
[Free] Blog Inventory Analysis Template
What Even Is a Blog Inventory Analysis?
An Inventory Analysis does two things:
takes note or “inventory” of all the urls you have in this subdirectory of your site
analyzes which ones are worth keeping, updating, removing, or redirecting
Simply put, an inventory analysis like this can help give you a very clear picture of your blog as a whole. From social shares, to backlinks, to traffic from each channel, there are so very many things that you have to think about when determining the performance of each individual blog post. For your monthly reporting, you might only look at traffic from email, organic search, social etc. so a full inventory analysis of your blog gives you the opportunity to look at other metrics as well!
Oh and did we mention that this is partially AUTOMATED! Yay! Less work for you!
When Should You Take An Inventory of Your Blog?
It is good practice to do an inventory of your website’s blog or article section every 6 months or at the very least every year. This way you can ensure that your content is timely, updated regularly and useful to your audience.
Perhaps one of the most important times to do an inventory of your long form content is when doing a migration. This is the perfect time to get rid of the bloat on your old site and start anew with only the most important urls.
What Does The Template Do?
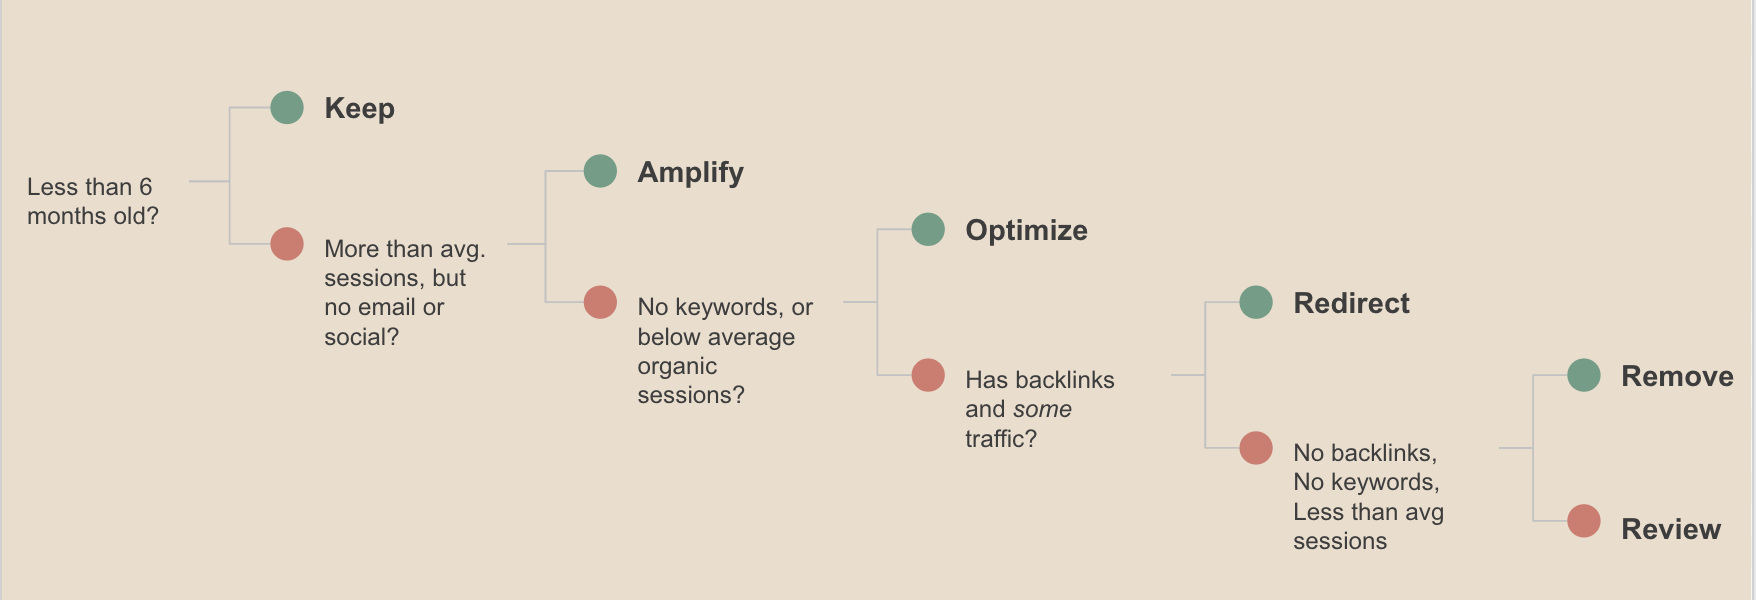
The logic behind the complex IF THEN statement that runs the automated article inventory suggestions.
The template is a simple google sheet that merges data from multiple data sources to give you a “lay of the land” or an overview of each of your blog posts. It then uses a pre-constructed IF - THEN statement to suggest an action. There are 6 main outcomes:
Keep - These are your best pages, the shining beacons of light that make people (and Google) love your content. Keep these and do more things like this.
Amplify - This is content that maybe could have done better but you kept it hidden under a bush so nobody saw it. Try revamping it and then amplifying this content before ditching it.
Optimize - This is content that did mediocrely but could probably do a lot better (esp. organically) if we rewrote that headline and added some keywords.
Redirect - This is usually old content that somebody cared about once upon a time, long long ago and it got some cute backlinks. We should retire these pieces and redirect any traffic or equity to a more recent page.
Remove - Proceed with caution before removing pieces. You should only remove pieces that NOBODY has visited, shared, or linked to in over a year or more.
Review - These are weird pieces that made it through our system without getting categorized because they’re between categories or just confusing. Manually review these.
What Data Sources Does the Template Use?
The sheet merges data from the following five data sources:
Google Analytics - this is a website analytics platform where we are pulling the following metrics for every page in your blog or article subdirectory
Total Sessions
Organic Sessions
Email Sessions
Social Sessions
Total Pageviews
Previous Pageviews
Bounce Rate
Landing Page Revenue or Goals
SEMRush - this is a keyword research and tracking tool where we are pulling the number of keywords that each of your pages ranks for. If a page ranks for tons of keywords, it should be kept or optimized.
Buzzsumo - this is a social sharing tool that we are using to get the total # of shares each article received on social media platforms. If something was shared, it should be kept.
ahrefs - this is a backlink research tool that we are using to get the total # of backlinks each article received from other domains in the wild. If something was linked to, it should probably be kept.
Screaming Frog - this is a website crawler which we will use to find all the urls in the subdirectory and extract their title and meta description for analysis.
Step By Step Guide To Perform a Blog Inventory Analysis
Follow these instructions to run your very own blog inventory analysis:
Share this sheet with a Google Account that has access to your client Google Analytics. Open the sheet with that GA account.
Setup the OVERVIEW Tab
Add the website to cell D7. This is important as it strips the URLs from your Screaming Frog download into ""Slugs"" in the FINAL tab so that they can be merged with GA data. If your slugs in the FINAL tab do not match GA, take a look at this again.
Add View ID to cell C10
Add URL path for your blog subdirectory in cell C13. (Your blogs all need to live in the same folder. The sheet only works for one subfolder at a time)
Once all your data is in the OVERVIEW tab, go to the top >> Add-Ons >> Google Analytics >> Run Reports (if you don't have this add on, you can add it here: https://workspace.google.com/marketplace/app/google_analytics/477988381226)
Add data to the BUZZSUMO tab
Go to Buzzsumo, type in client url in Content section. Download CSV and upload content to the BUZZSUMO tab
Add data to the AHREFS tab
Go to Ahrefs, type in client url, go to Top Content, Export CSV. Then upload content to the AHREFS tab.
Add data to the SEMRUSH tab
Go to SEMrush, type in the client url, add a filter for the subdirectory or page type you are analyzing. Export all keywords for those pages. Paste in the SEMRUSH Tab. These will then get aggregated in the IMPORT tab and sent to the FINAL tab for your analysis.
Add crawl to SCREAMINGFROG tab
Go to Screamingfrog, crawl the subdirectory, Export as CSV. Upload the relevant columns to the SCREAMING FROG tab. You only really need the URLs here and status/meta if you want it. Make sure the columns match before you export to CSV
Navigate to the FINAL tab. Now the FINAL tab should be populated with data from each upload.
Drag down the formula in Column C so that each row has an ""Action"" assigned to it.
Paste all the data in the FINAL tab as text by using the Automate drop down above. You will have to give the script access the first time you run it. By pasting as text you will be able to filter the FINAL tab as you see fit!
Template Inventory Analysis Link
Now that you’ve read through all that fun stuff, here is the link to our automated blog inventory analysis. Please make a copy and customize as you see fit! Let us know on twitter @themerrymary if it worked out for you!
FAQ & Common “gotchas!’
If there are too many URLs in each action category you can use the hidden Variables tab and the Automate drop down menu to create a priority score to help you prioritize the urls in each category. If you use this functionality, unhide column V from the FINAL tab.
If you have too many keywords, you can limit the export to KW with a certain monthly search volume.
If GA is not set up to report on slugs (i.e. /blog/article-title) then you will need to customize the FINAL tab
You MUST run this with a Google account that has access to the client Google Analytics Account
Since Actions are determined by ranges of your own data, it is imperative that you only run this for one type of page (i.e. a blog subdirectory, all .pdf pages etc). "
How Can I Change the Date Range
In the OVERVIEW tab you can customize the date range. By default it will look at 365 days of data ending on the last full month. Keep in mind that a date range that is less than 365 days might erroneously mark articles that are seasonal as ones that should be discarded. A full year of data will ensure that seasonal articles are evaluated appropriately.
Can I customize the IF THEN Statement?
You sure can! This is just a template to get you started, but if you care about other metrics or want to create stricter rules, feel free to customize as you see fit!
Can I use this for my entire site?
Not really. It will * work * if you try to run it on your whole site but it won’t work well because each part of your site should have it’s own benchmarks. The IF THEN statement is based on averages and standard deviations of your page data. If you are an ecommerce website and you try to run an inventory of the whole site, more often than not, your product pages will have soooo much higher numbers than your blog or article pages that they’ll skew the numbers and the formulas will mark all the blogs are under-performers and suggest that you get rid of them. This is 100% NOT what you should do and the main reason that we made this specifically for one subdirectory at a time.
Can I Remove Your Logo?
Please don’t! We put in a lot of hard work into this template and while we love to share, we still need those credz. Thanks for understanding ♥ We design custom data studios if you want a template with your brand colors and logo. Email mary@theflourish.co if you’re interested!
Does this work with Adobe Analytics?
No, this template was made specifically for Google. The way Adobe Analytics works makes each account a lot more custom so it’s harder to make general templates like this for that platform. ☹
If you enjoyed this template, consider supporting my template-making at https://buymeacoffee.com/themerrymary